Something I find myself having to do unfortunately frequently is debugging code that I didn't write, my team didn't write, and my company didn't write.
For an example, a couple weeks ago I was trying to figure out why authentication failed on a particular web service if any cookie contained the @ symbol in the name. The core code for that, for this particular web service, is inside Microsoft's ASP.NET Web API stack. Some of the code for that is part of .NET Framework but does not appear on the .NET Framework Reference Source website, while other parts are open-source, but digging around and piecing together the structure of the Web API stack is a lot more difficult than clicking "Step Into" in a debugger.
Unfortunately, you can't simply step into third party code by default in Visual Studio, but there aren't many steps to take in order to be able to do just that.
Here's a simple example app that we can use to see the problem I faced. It requires referencing the Microsoft.AspNet.WebApi.Client NuGet package:
using System;
using System.Linq;
using System.Net.Http;

class Program
{
    static void Main()
    {
        var request = new HttpRequestMessage();
        request.Headers.Add("Cookie", "auth_token=abcdef; a@b=c");

        var authTokenCookies = request.Headers.GetCookies("auth_token");

        foreach (var cookie in authTokenCookies.SelectMany(c => c.Cookies))
        {
            Console.WriteLine($"Auth token = {cookie.Value}");
        }
    }
}
If we run this program, it prints no output, because it couldn't find our first cookie in the header line, the auth_token cookie. That's weird, so let's see why.
The method we want to debug here is the call to GetCookies("auth_token"). If we set a breakpoint and click on "Step Into", Visual Studio will just step straight over the line.
You might think that we can fix it by disabling "Just My Code" in the debugger settings (about halfway down the right-hand panel):
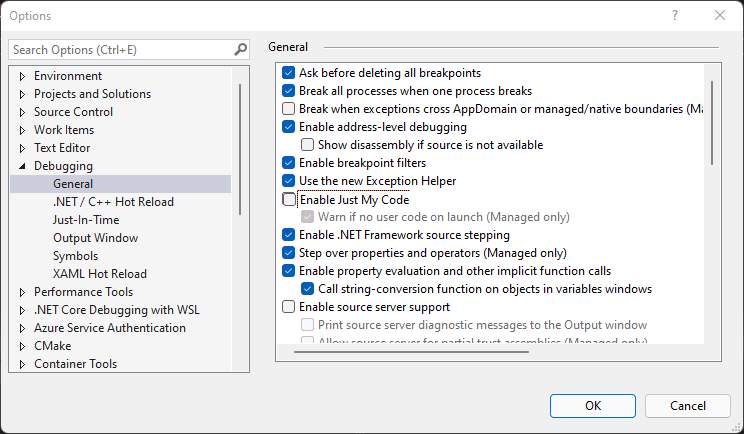
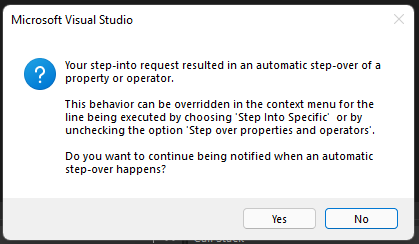
But if we do that, all we will get is a popup that tells us that the method is being stepped over, and doesn't let us change that:
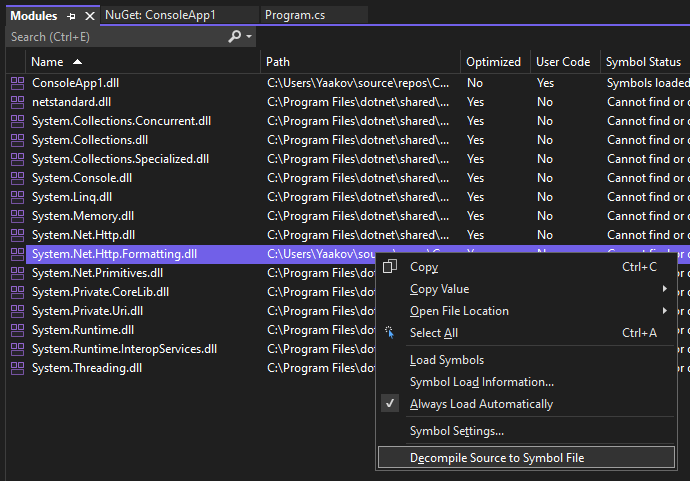
The secret here is to go to Debug > Windows > Modules, select the DLL that contains the code we want to step into, and from the context menu, select "Decompile Source to Symbol File":
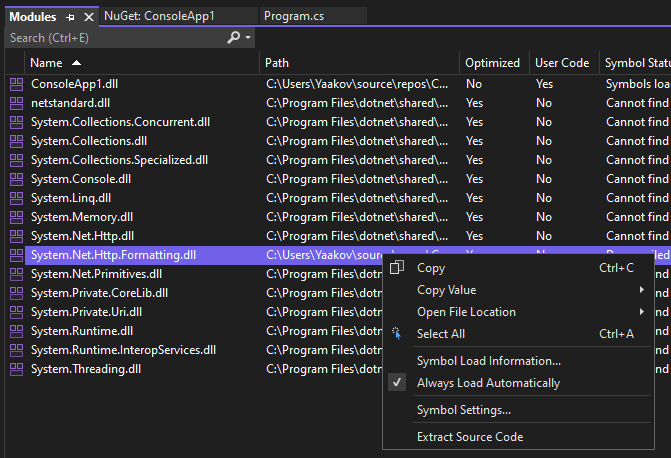
If you want to browse around the decompiled code and set breakpoints too then you'll need to right-click the DLL again, and from the context menu, select a new option, "Extract Source Code":
Now if we step into it (with Just My Code disabled), you can step through the decompiled code, examining locals and observing the different decisions that the underlying code makes and the different branches that it takes.

(Note that this is optimised code typically from a Release configuration. It is not as easy to debug as code built in a Debug configuration, and in many places the debugger might appear to skip a line, or local variables might be optimised away, or breakpoints might fail to bind, etc. Debugging this kind of code is an additional debugging skill that takes time and practice to build up.)
If we step through this particular scenario, we can see that we get an exception that is raised (and later swallowed) because the cookie helper methods that we are using validate the cookie name, and a@b is not considered to be a valid name:
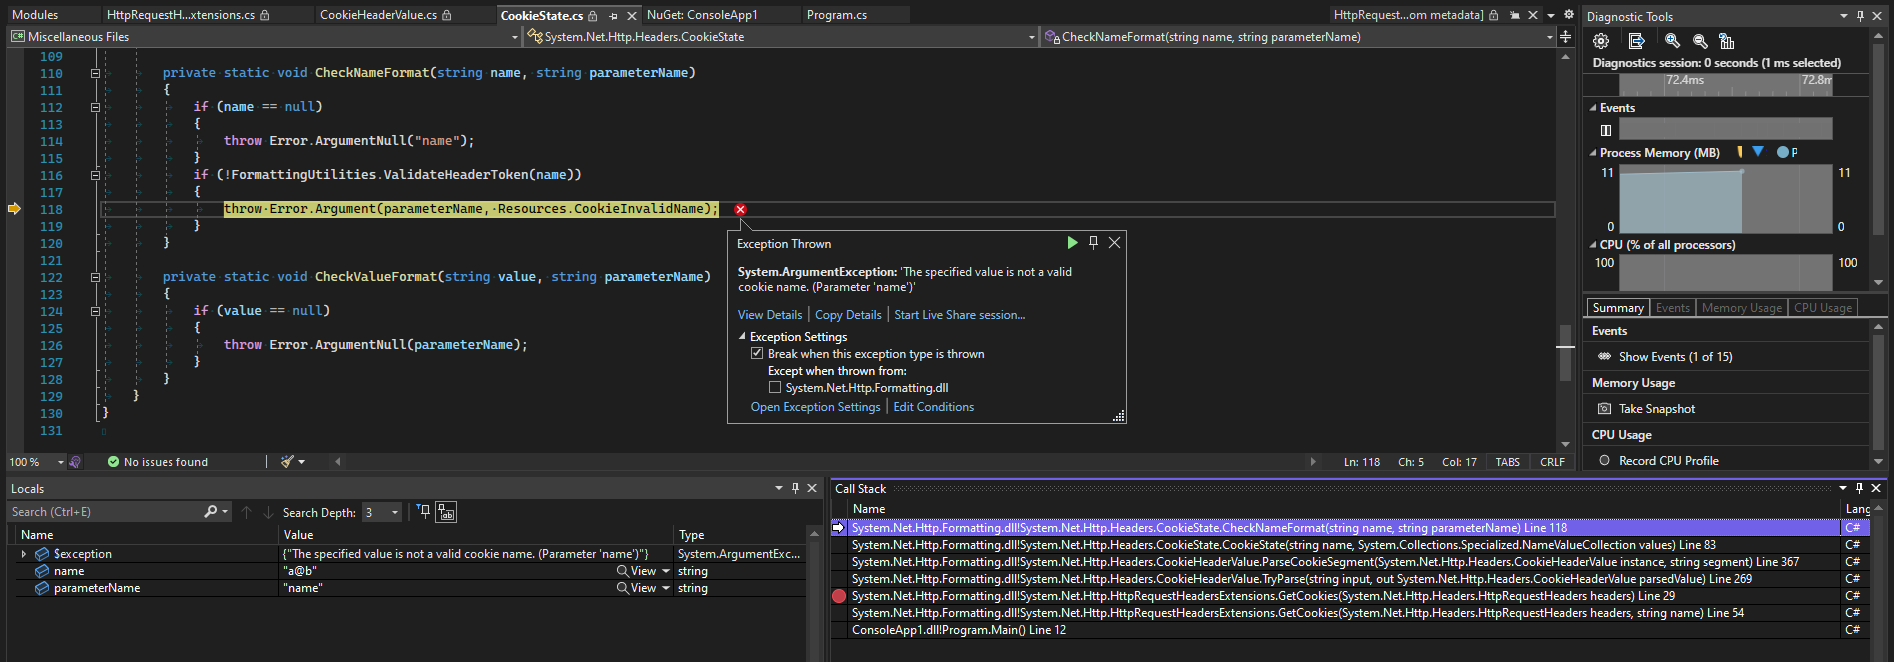
Indeed, if we consult the relevant standard for cookies, it says that the syntax for a cookie-name is a token as defined in RFC 2616 Section 2.2. That section says:
token          = 1*<any CHAR except CTLs or separators>
separators     = "(" | ")" | "<" | ">" | "@"
               | "," | ";" | ":" | "\" | <">
               | "/" | "[" | "]" | "?" | "="
               | "{" | "}" | SP | HT
Simply put, a cookie name (token) cannot contain a separator, and @ is one of the listed separators. The name of our cookie is illegal, and whatever is setting that cookie really shouldn't be doing that.
The rest of that, however, is irrelevant to the main point here. With a few not-particularly-obvious menu options, we've managed to step through third-party .NET code in Visual Studio to understand what it was doing and explain the misbehaviour of our higher-level software.


